

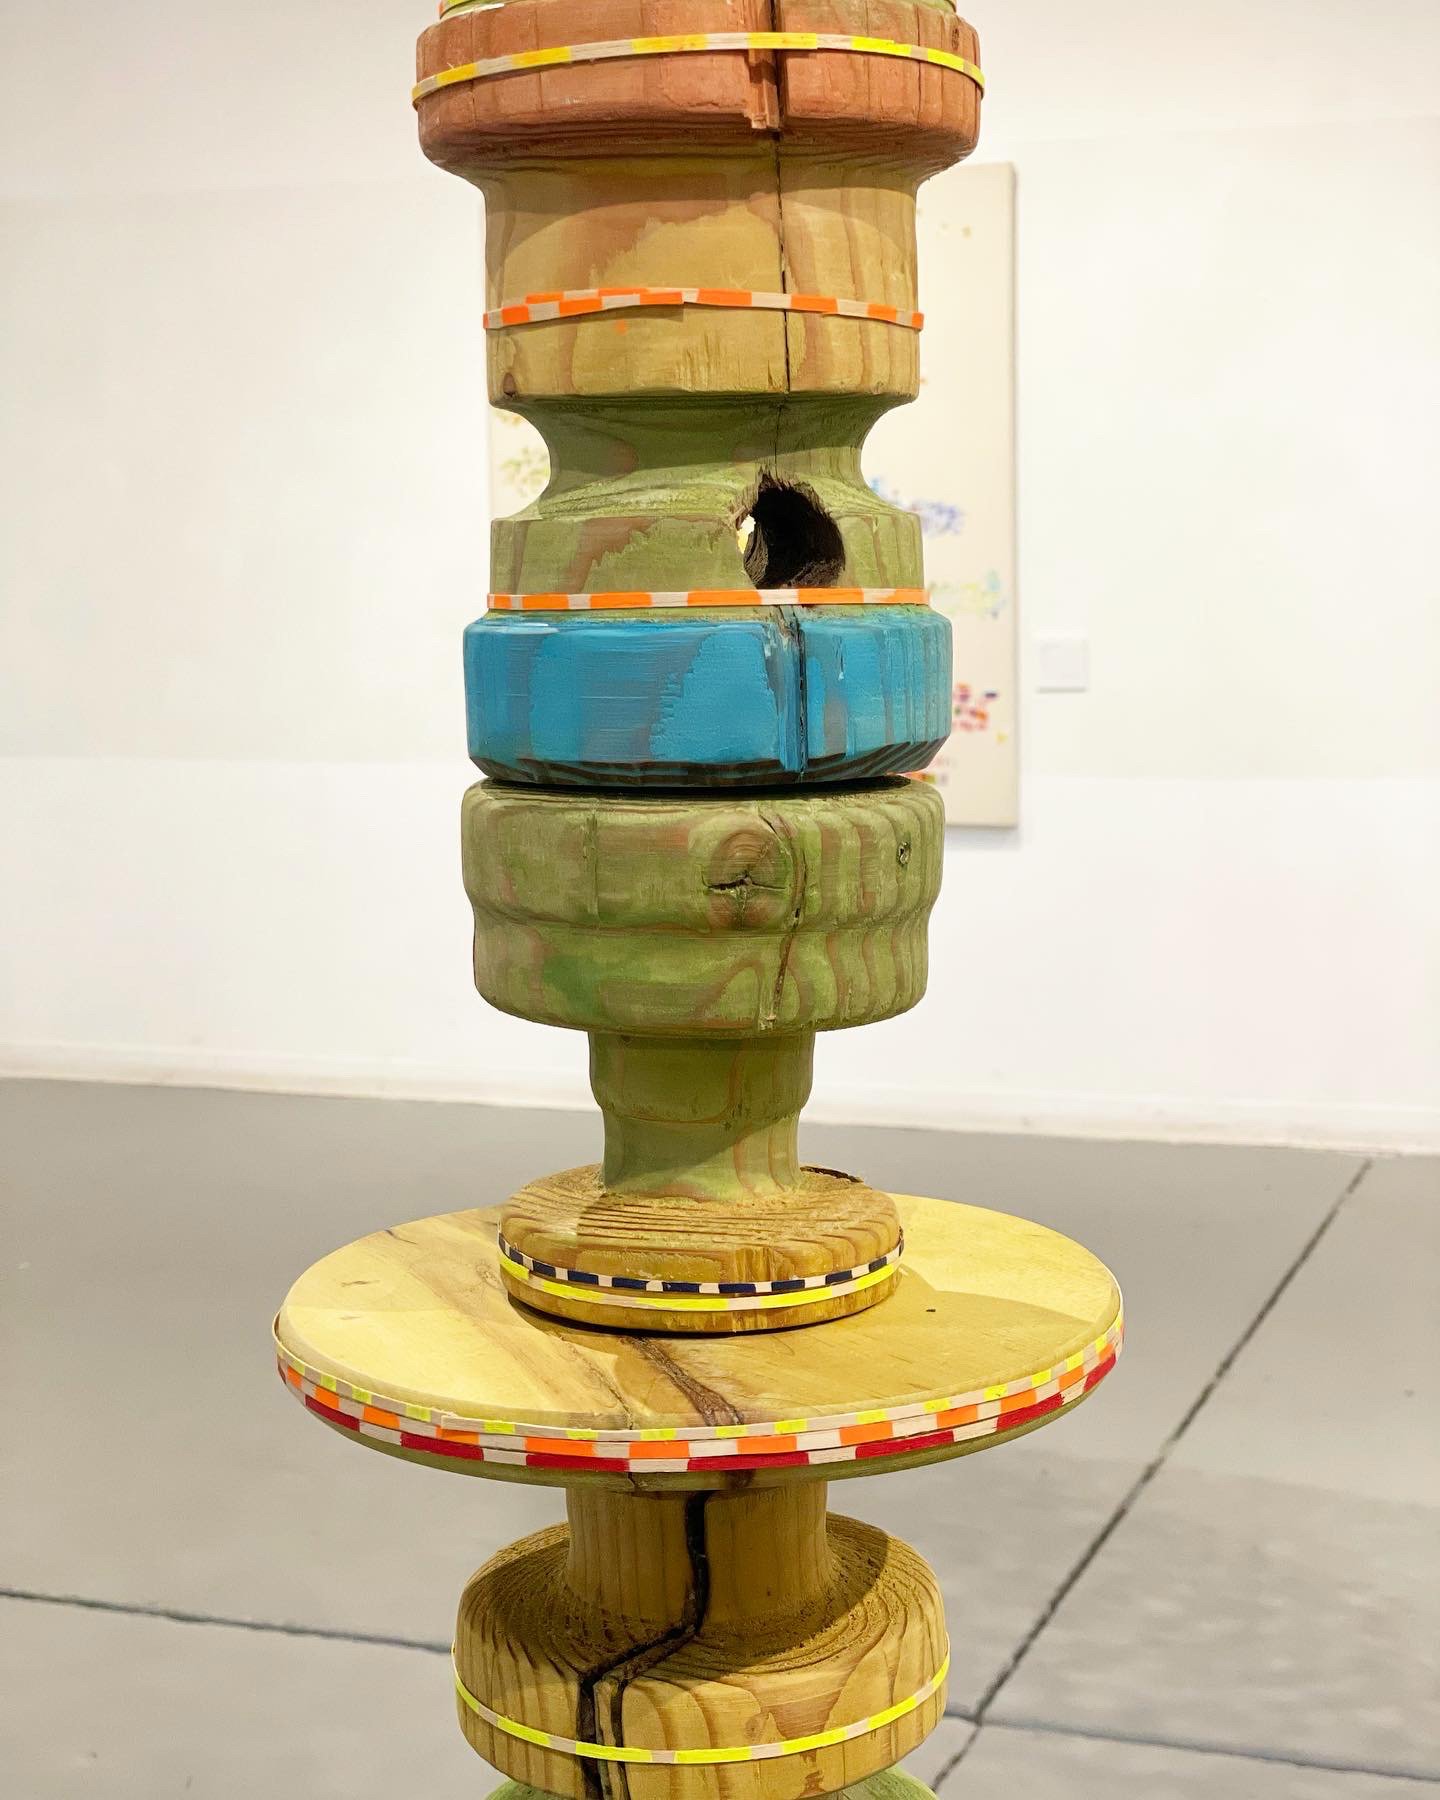

Climate Markers: Peak Streamflow (Passaic River 1898-2020), 2022
Ship mast carved on a lathe, dye
11’x16”
Part of a suite of artworks Commissioned by NOAA and the NJ Department of Environmental Protection
Diameters determined by measurements made by a nearby USGS water gauge that calculates how much water is coursing through the Passaic River, a tidal body of water that regularly floods and is home to a superfund site and major contamination. The diameter of each band represents 1 year of water, the color corresponds to the average annual temperature, which has risen by 5 degrees in Passaic in the past 100 years.